Max Pain in Options Trading Explained
Understand Max Pain in crypto options, from reading the chart and the dealer hedging that causes pinning to the limits every trader should know.

Disclosure: Coinperps may earn a commission from partner links, at no extra cost to you. Reviews are based on independent testing — see how we test.
- Max Pain is the strike price where the combined value of expiring calls and puts is lowest, producing the smallest possible payout to option holders and the best outcome for sellers.
- Pinning has a mechanical cause, since dealers hedging large option books buy below heavily traded strikes and sell above them, which dampens volatility and pulls price toward the level.
- Treat the level as context, not a target, because Max Pain shifts constantly with open interest, varies between exchanges, and is easily overwhelmed by news or a genuine trend.
Twice a week, the Bitcoin market runs into a number that no chart pattern predicted and no analyst forecast. Price drifts toward a strike, stalls there through settlement, then breaks hard in whichever direction it was heading before. That number is Max Pain.
The name is unusually literal. It marks the price at which the greatest quantity of expiring options becomes worthless, inflicting maximum financial pain on the traders holding them while handing the sellers a clean profit on premiums already collected.
What makes it worth studying is not the folklore about market makers rigging expiries. It is the genuine, documented hedging mechanism underneath, and the equally genuine fact that the level fails often enough that treating it as a forecast will cost you money. This guide covers both sides.
What is Max Pain in Options Trading?
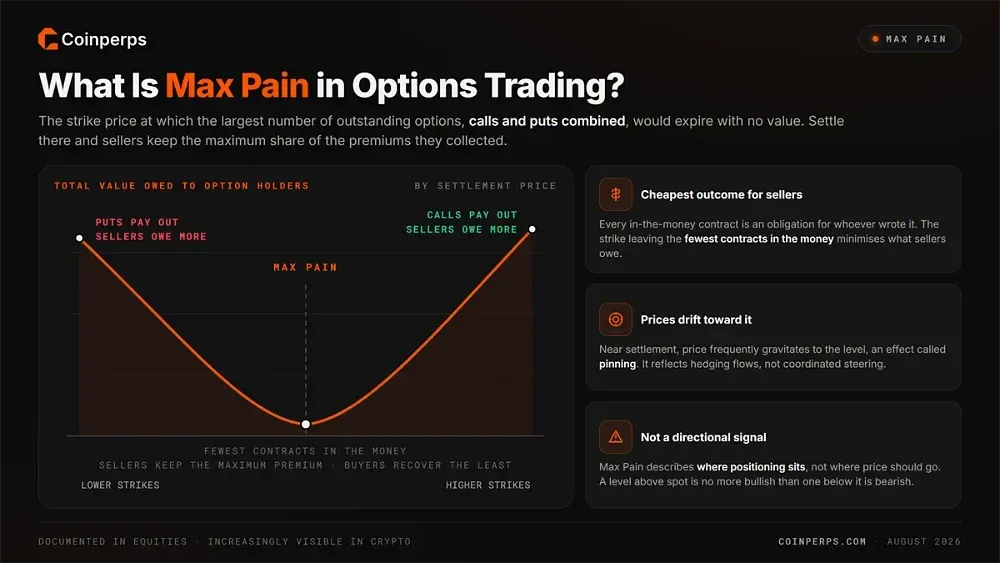
Max Pain is the strike price at which the largest number of outstanding options, calls and puts combined, would expire with no value. Settle there and option sellers keep the maximum share of the premiums they collected, while buyers across the chain recover the least.
The level sits where the total intrinsic value owed to option holders reaches its minimum across the entire chain. Because every in-the-money contract represents an obligation for whoever wrote it, the strike that leaves the fewest contracts in the money is the cheapest outcome for sellers collectively.
Traders watch it because prices frequently drift toward that strike as settlement approaches, an effect known as pinning. The behaviour is well documented in equities and increasingly visible in crypto, though it reflects hedging flows rather than any coordinated effort to steer the market.
Understanding what the level actually represents prevents the most common misreading. Max Pain describes where positioning currently sits, not where price should go, and it carries no directional message on its own. A level above spot is no more bullish than one below it is bearish, as our crypto options platforms guide explains.
How Is Max Pain Calculated?
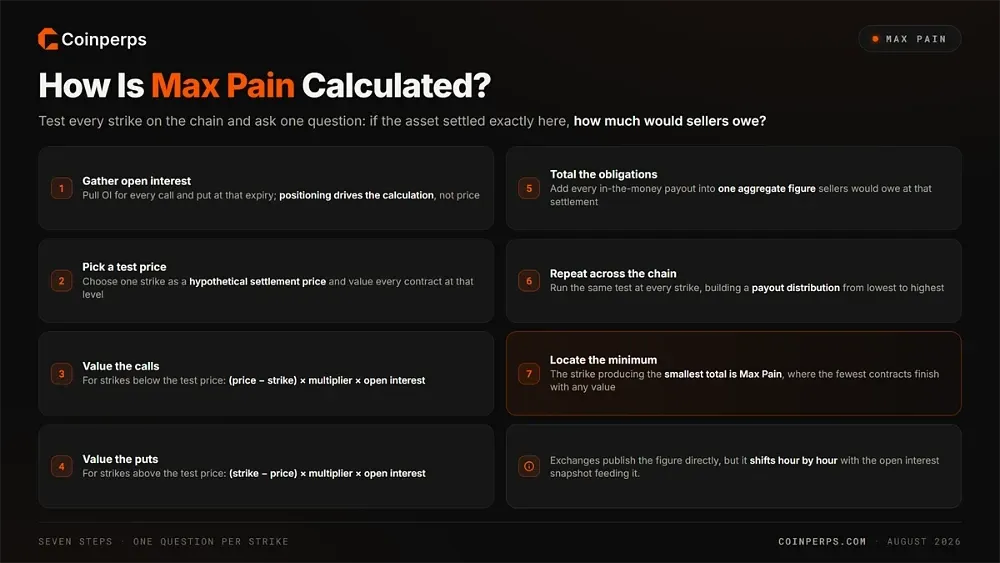
The calculation tests every strike on the chain and asks one question: if the asset settled exactly here, how much would sellers owe?
Work through these seven steps:
- Gather open interest: Pull the open interest for every call and put strike at that expiry, since positioning rather than price drives the calculation.
- Pick a test price: Choose one strike from the chain as a hypothetical settlement price, then evaluate what every other contract would be worth at that level.
- Value the calls: For strikes below your test price, multiply the difference between price and strike by the contract multiplier and that strike's open interest.
- Value the puts: For strikes above your test price, multiply the difference between strike and price by the contract multiplier and the open interest at that strike.
- Total the obligations: Add every in-the-money call and put payout together to produce the aggregate amount sellers would owe at that specific settlement price.
- Repeat across the chain: Run the same calculation at every strike, building a distribution showing total payout obligations from the lowest strike to the highest.
- Locate the minimum: The strike producing the smallest total is Max Pain, the settlement price where the fewest contracts finish with any value at all.
In practice, exchanges publish the figure directly, so manual calculation is rarely necessary for a working trader. What matters is recognising that the output depends entirely on the open interest snapshot feeding it, which shifts hour by hour as traders open and close positions.
How to Read a Max Pain Chart
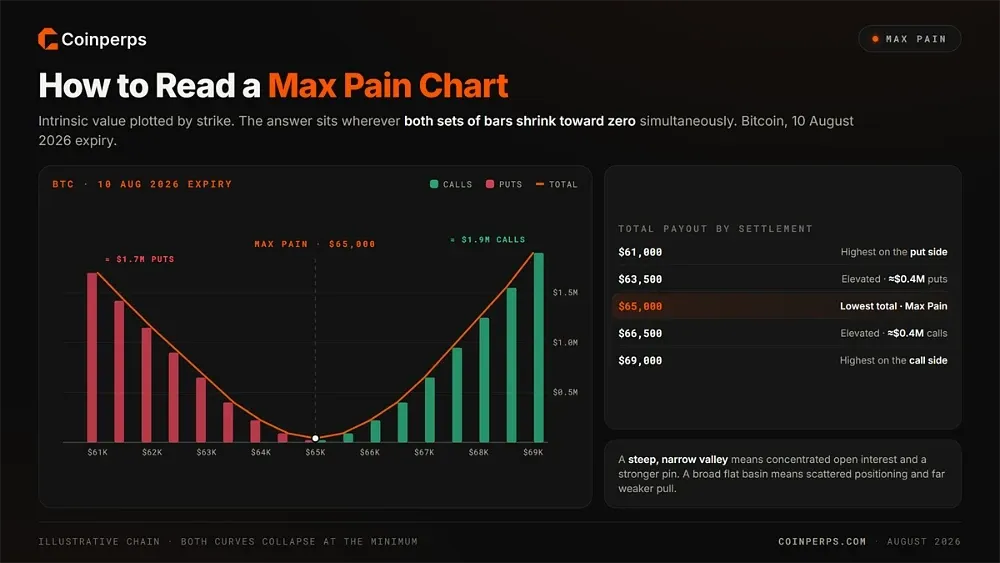
Most Max Pain displays plot intrinsic value by strike price, using separate colours to distinguish the calls from the puts. Reading one takes only seconds once you understand that the answer always sits wherever both sets of bars shrink toward zero simultaneously.
Consider the Bitcoin chart for the 10 August 2026 expiry, which places Max Pain at $65,000. Put intrinsic value climbs steeply as strikes fall away, reaching roughly $1.7 million at the $61,000 level, because every put above settlement finishes in the money and must be paid.
Call intrinsic value does the opposite, rising toward $1.9 million at $69,000 since settling that high would leave a large stack of calls profitable. Between those extremes both curves collapse, and the point where their combined total bottoms out is the Max Pain strike.
The shape carries information beyond the single number. A steep, narrow valley indicates open interest concentrated around a few strikes, which strengthens any pinning tendency, while a broad flat basin means positioning is scattered and the level exerts far weaker pull.
Why Price Gravitates Toward Max Pain
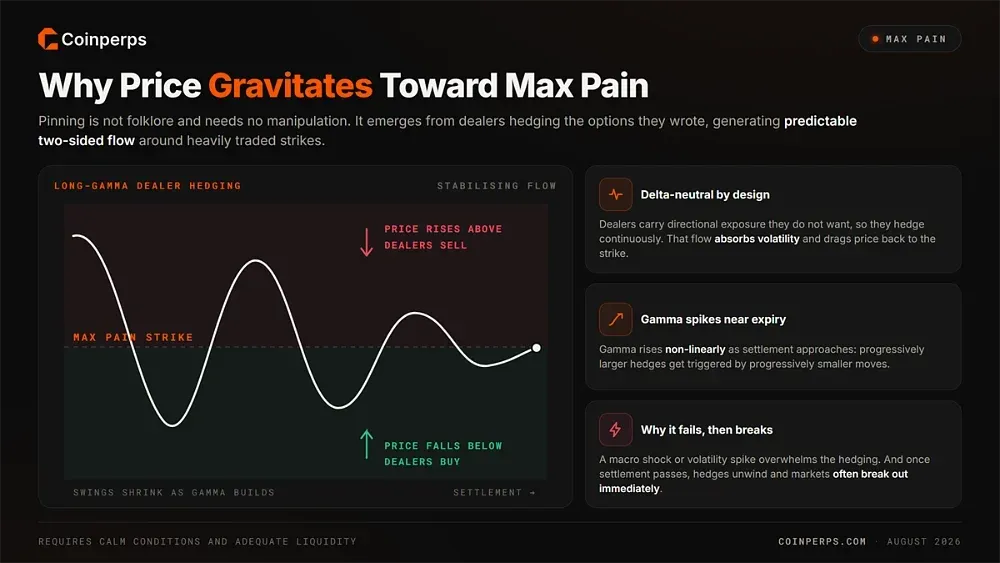
The pinning effect is not folklore, and it does not require anyone manipulating anything. It emerges from how market makers manage risk on the options they have written, a process that generates predictable buying and selling flow around heavily traded strikes.
Dealers who sell options carry directional exposure they do not want, so they hedge continuously to stay delta neutral. When they hold net long gamma, that hedging is stabilising: price rising above a major strike prompts them to sell the underlying, while price falling below it prompts them to buy.
That two-sided flow absorbs volatility and drags price back toward the strike each time it wanders away. The effect intensifies sharply near settlement because gamma rises non-linearly as expiry approaches, meaning progressively larger hedges get triggered by progressively smaller price moves.
The mechanism also explains its own failures. Pinning requires calm conditions and adequate liquidity, so a macro shock, a large directional flow, or a volatility spike easily overwhelms dealer hedging. It also explains why markets often break out immediately after settlement, once those hedges unwind and the anchoring flow disappears.
Max Pain in Crypto Options (Bitcoin, Ethereum, and More)
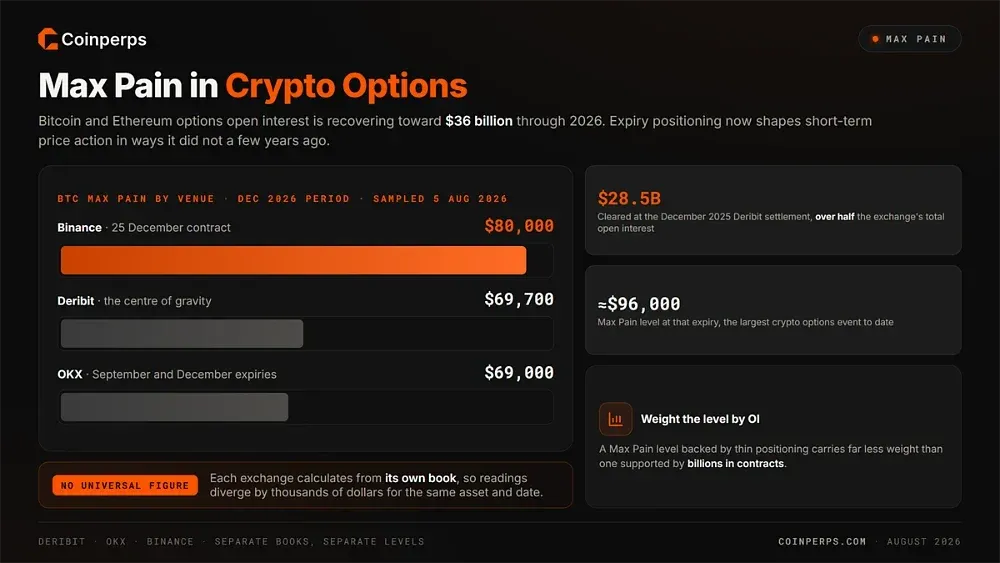
Crypto has become a genuine options market rather than a curiosity, with Bitcoin and Ethereum options open interest recovering toward $36 billion through 2026. That scale means expiry positioning now shapes short-term price action in ways it simply did not a few years ago.
Deribit remains the centre of gravity, and its expiries have grown large enough to matter macro-economically. The December 2025 settlement cleared roughly $28.5 billion across Bitcoin and Ethereum, over half the exchange's total open interest, against a Max Pain level near $96,000 at the time.
Readings vary meaningfully between platforms, which is the first practical lesson. Data sampled on 5 August 2026 put OKX near $69,000 for the September and December expiries, Binance closer to $80,000 around the 25 December contract, and Deribit around $69,700 for the same period.
That divergence exists because each exchange calculates from its own book, so no universal Max Pain figure exists for Bitcoin. Traders comparing levels should also track open interest alongside them, since a Max Pain level backed by thin positioning carries far less weight than one supported by billions in contracts.
Max Pain in Traditional Markets (Stocks and Index Options)
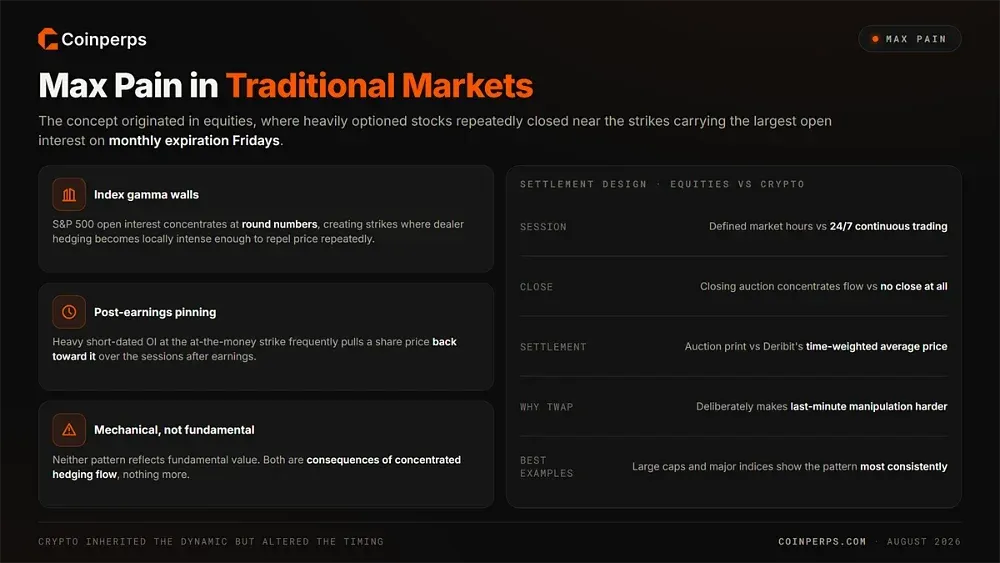
The concept originated in equities, where traders noticed that heavily optioned stocks repeatedly closed near the strikes carrying the largest open interest on monthly expiration Fridays. Large-cap names and the major indices continue to show the pattern most consistently of all.
Index options produce the clearest examples because their open interest concentrates at round numbers. Strikes on the S&P 500 accumulate enough positioning to create what traders call gamma walls, levels where dealer hedging becomes locally intense enough to repel price repeatedly.
Single stocks display a related effect after earnings, when heavy short-dated open interest at the at-the-money strike frequently pulls the share price back toward it over subsequent sessions. Neither pattern reflects fundamental value, since both are mechanical consequences of concentrated hedging flow.
Crypto inherited the dynamic but altered the timing. Equity options settle during defined market hours with a closing auction, while Bitcoin trades continuously and Deribit settles against a time-weighted average price, a design that deliberately makes last-minute price manipulation harder.
How Traders Use Max Pain
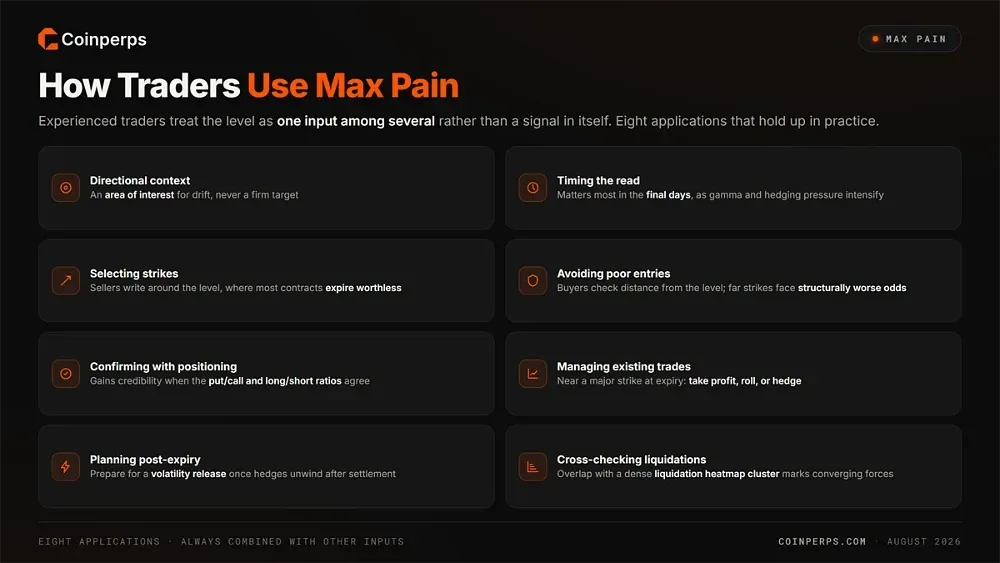
Experienced traders treat Max Pain as one input among several rather than a signal in itself. These are the eight applications that hold up in practice:
- Directional context: Traders use the level to frame a bias about where price may drift, treating it as an area of interest rather than a firm target.
- Timing the read: The level matters most in the final days before settlement, since gamma and the resulting hedging pressure both intensify sharply as expiry nears.
- Selecting strikes: Option sellers write contracts around Max Pain deliberately, positioning where the greatest number of contracts is likely to expire without value.
- Avoiding poor entries: Buyers check how far their chosen strike sits from Max Pain, recognising that distant contracts face structurally worse odds of finishing profitable.
- Confirming with positioning: The level gains credibility when the put/call ratio and the long/short ratio point the same direction as the implied drift.
- Managing existing trades: Traders approaching a major strike near expiry use the level to decide whether to take profit, roll forward, or hedge exposure.
- Planning post-expiry: Many prepare for a volatility release once settlement passes, watching sentiment gauges like the fear and greed index as hedges unwind.
- Cross-checking liquidation zones: A Max Pain strike overlapping a dense cluster on the Bitcoin liquidation heatmap marks a level where two independent forces converge.
Common Misconceptions and Limitations
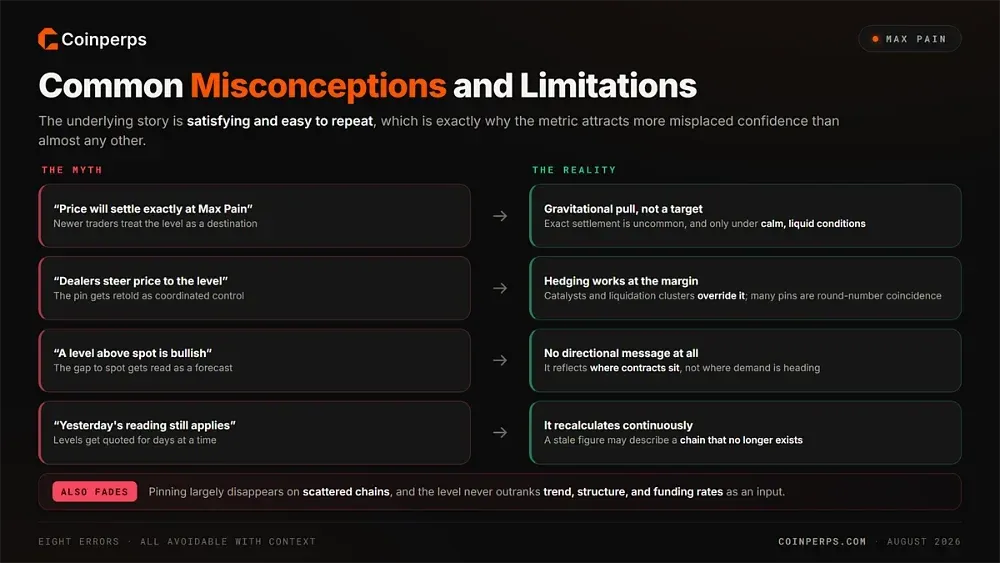
Max Pain attracts more misplaced confidence than almost any other metric, largely because the underlying story is satisfying and easy to repeat.
These eight errors cause the most damage:
- Expecting exact settlement: Price finishing precisely at Max Pain is uncommon, since the level indicates gravitational pull under favourable conditions rather than a destination.
- Mistaking coincidence for causation: Many apparent pins are ordinary price action landing near a round number that also happens to carry heavy open interest.
- Ignoring catalysts: Macro data, regulatory news, and clusters on the Ethereum liquidation heatmap override hedging flows that no concentrated gamma survives.
- Using stale figures: The level recalculates continuously as positions open and close, so a reading from yesterday may describe a chain that no longer exists.
- Applying it to scattered chains: Pinning depends on open interest concentrating at a handful of strikes, and the effect largely disappears when positioning spreads evenly.
- Assuming dealers control price: Hedging flow influences a market at the margin, but no participant steers a liquid asset like Bitcoin through positioning alone.
- Reading it directionally: A Max Pain level above spot does not forecast a rally, since the number reflects where contracts sit rather than where demand is heading.
- Weighting it too heavily: Newer traders frequently prioritise the level above trend, structure, and funding rates, which are all more reliable inputs.
Origins of the Max Pain Theory
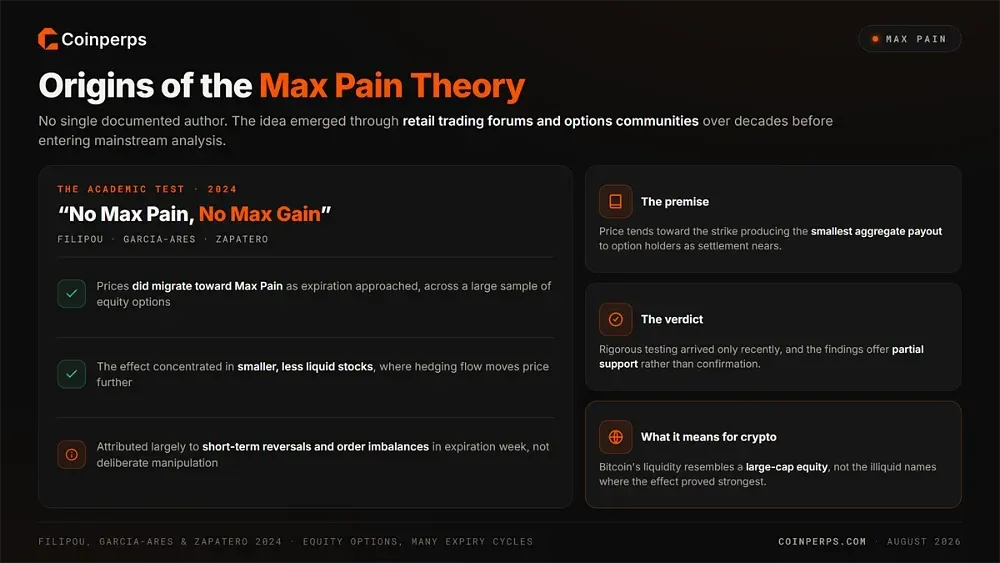
The theory has no single documented author, having emerged through retail trading forums and options communities over decades before entering mainstream analysis. Its premise is that price tends toward the strike producing the smallest aggregate payout to option holders as settlement nears.
Rigorous academic testing arrived comparatively recently. The 2024 paper No Max Pain, No Max Gain by Filipou, Garcia-Ares, and Zapatero examined whether observed price behaviour actually matches the claim, drawing on a large sample of equity options across many expiration cycles.
Their findings offer partial support. Prices did tend to migrate toward Max Pain as expiration approached, with the effect concentrated in smaller and less liquid stocks where a given quantity of hedging flow moves price further than it would in a deep market.
The authors attributed much of the pattern to short-term reversals and order imbalances intensifying during expiration week rather than to deliberate manipulation. That distinction matters for crypto, where Bitcoin's liquidity resembles a large-cap equity far more than the illiquid names where the effect proved strongest.
Limitations of Max Pain in 24/7 Crypto Markets
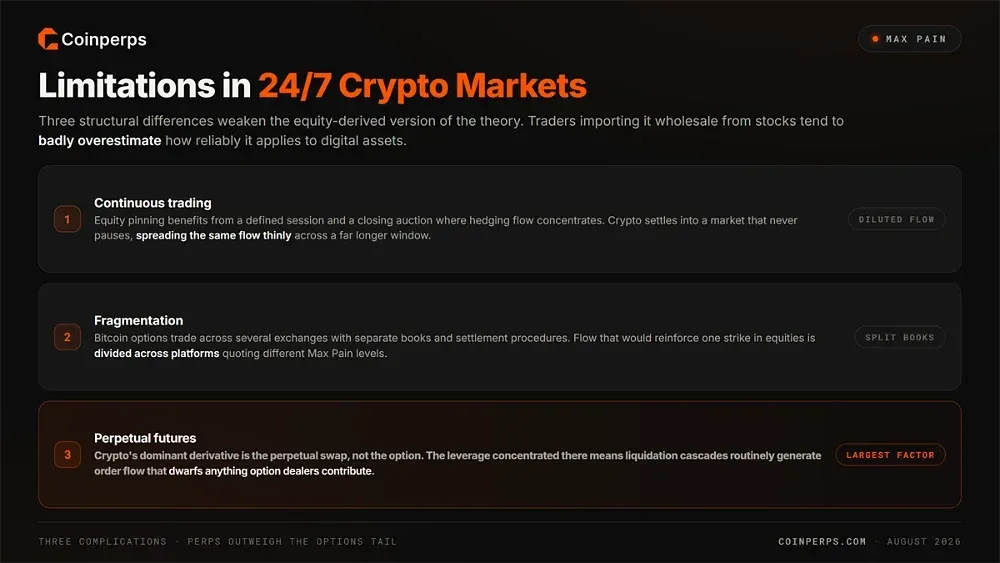
Crypto introduces several structural differences that meaningfully weaken the equity-derived version of this theory, and traders importing the concept wholesale from the stock market tend to badly overestimate how reliably it actually applies to digital assets in daily practice.
Continuous trading is the first complication. Equity pinning benefits from a defined session and a closing auction where hedging flow naturally concentrates, while crypto settles into a market that never pauses, spreading that same flow thinly across a far longer window.
Fragmentation is the second complication here. Bitcoin options trade across several exchanges running entirely separate books and settlement procedures, so hedging flow that would reinforce one single strike in equities ends up divided across platforms quoting quite different Max Pain levels.
Perpetual futures are the third and largest complication of all. Crypto's dominant derivative is not the option but the perpetual swap, and the leverage concentrated there means liquidation cascades routinely generate order flow that dwarfs anything the option dealers contribute.
Bottom Line
Max Pain sits at an unusual intersection of market mechanics and trader folklore. The hedging flow behind it is real and measurable, the tendency for price to drift toward heavily optioned strikes is documented in academic work, and the effect is visible around every major Bitcoin expiry.
What it is not is a forecast. The level moves constantly, differs between exchanges, weakens when positioning scatters, and disappears entirely when a genuine catalyst arrives. Traders who lose money on it are almost always those who treated a probabilistic drift as a price target.
Used properly, it earns a modest place in a broader process that also weighs spot and perpetual positioning. Check it in the final days before a major expiry, confirm whether open interest is concentrated enough to matter, cross-reference it against positioning data, and expect volatility to return once settlement clears the board.
FAQs
