VWAP Indicator Explained: How to Use It in Crypto
Learn how the VWAP indicator works, how to set it up on TradingView, and how crypto traders use it for intraday bias, entries, and execution benchmarks.

- VWAP is a volume-weighted benchmark that shows the average price an asset traded at during a session, giving more weight to levels where real size changed hands.
- The daily reset is the catch in crypto, since 24/7 markets restart VWAP at midnight UTC, which makes anchored VWAP the more useful tool for multi-day positioning.
- Confluence beats the line alone, so pairing VWAP with funding rates, liquidation clusters, and volume profile turns a simple average into a genuine decision framework.
Most indicators tell you where price has been. VWAP tells you where money has been, and that distinction is why institutional desks measure their own execution against it while retail traders mostly use it as a moving average with extra steps.
The difference matters because a price level touched briefly on thin volume and a level where billions changed hands are not equivalent, even though a standard moving average treats them identically. VWAP weights by participation, so the line sits where the market actually transacted.
With Bitcoin trading near $63,000 in early August 2026 and chopping below its longer-term moving averages, sessions are exactly the kind where VWAP earns its place: enough intraday movement to trade, not enough trend to follow blindly.
This guide covers the calculation, the setup, and where the indicator quietly fails. 🔽
What is the Volume-Weighted Average Price (VWAP) Indicator?
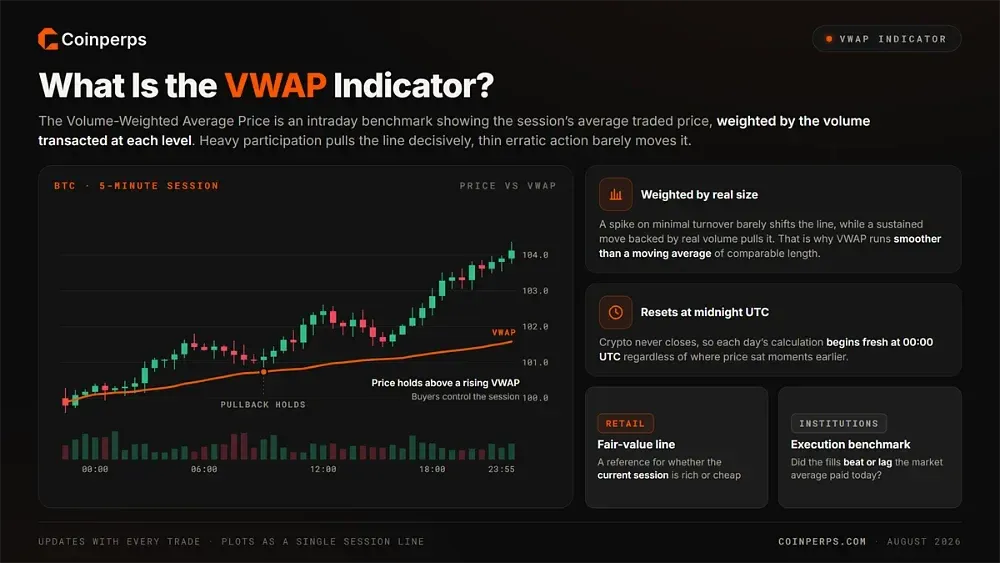
The Volume-Weighted Average Price is an intraday benchmark showing the average price an asset has traded at across a session, weighted by the volume transacted at each level. Where a simple moving average treats every candle equally, VWAP gives proportionally more influence to periods of heavy participation.
It plots as a single line that updates with every trade and resets when the session restarts. In crypto that reset lands at midnight UTC, since markets never close, meaning each day's calculation begins fresh regardless of where price sat moments earlier.
The line typically looks smoother than a moving average of comparable length because volume dampens the effect of thin, erratic price action. A brief spike on minimal turnover barely shifts VWAP, while a sustained move backed by real size pulls it decisively.
Its dual role explains the widespread popularity. Retail traders read it as a fair-value reference for the current session, while institutions use it as an execution benchmark to judge whether their own fills beat or lagged the market average across an accumulation window.
How VWAP Is Calculated
Understanding the formula matters because it explains exactly why VWAP behaves so differently from every price-only indicator sitting on your chart. The arithmetic is considerably simpler than the intimidating name suggests, and knowing it changes how you read the line.
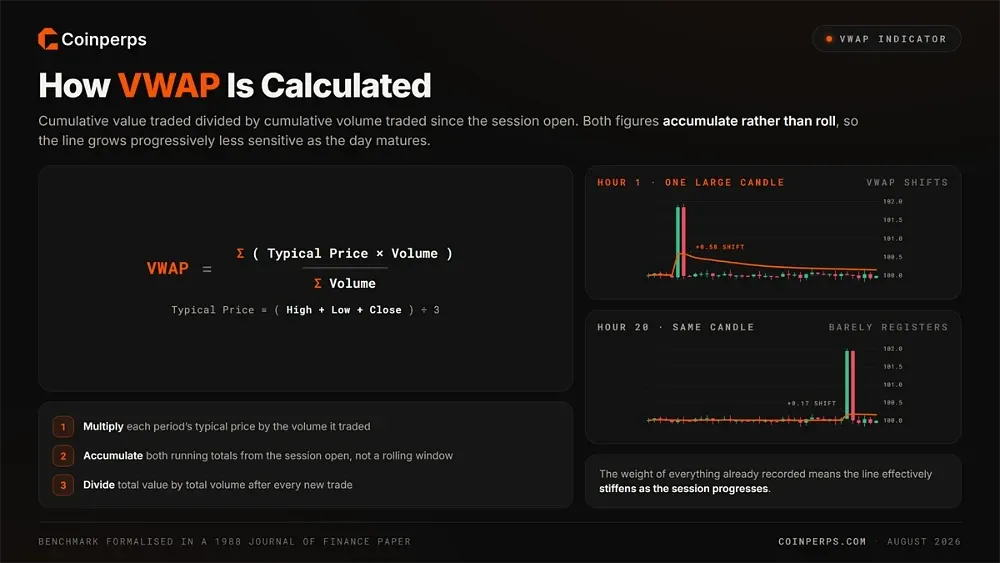
VWAP divides the cumulative value traded by the cumulative volume traded since the session began. For each period you multiply the typical price, meaning the high, low, and close averaged together, by that period's volume, then divide the running total by total volume so far.
Written plainly, the formula is cumulative value traded divided by cumulative volume traded, a benchmark formalised in a 1988 Journal of Finance paper. Because both figures accumulate from the session open rather than rolling forward, VWAP grows progressively less sensitive to new candles as the session matures.
That accumulation is the key behavioural quirk. An hour into a session, a single large candle can move VWAP noticeably, but twenty hours in, the same candle barely registers against the weight of everything already recorded. The line effectively stiffens as the day progresses.
How Is VWAP Used in Trading?
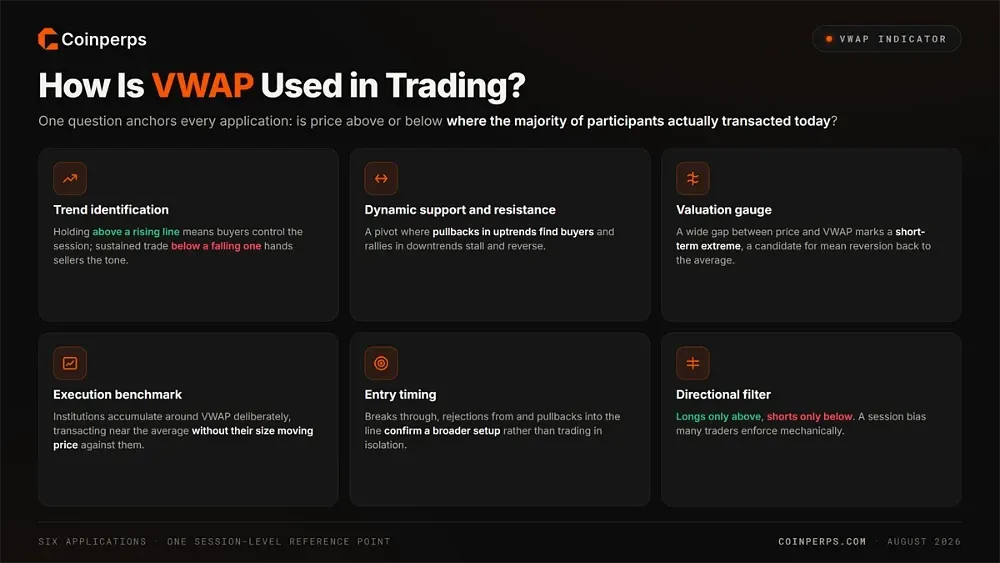
VWAP works as a session-level reference point that answers a specific question: is price currently above or below where the majority of participants actually transacted today? That framing supports several distinct applications.
Traders apply VWAP across these six scenarios:
- Trend identification: Price holding above a rising VWAP line indicates buyers control the session, while sustained trading beneath a falling line signals sellers are setting the tone.
- Dynamic support and resistance: VWAP frequently acts as a pivot where pullbacks in an uptrend find buyers, or where rallies in a downtrend stall and reverse.
- Valuation gauge: A wide gap between price and VWAP suggests a short-term extreme, prompting traders to watch for mean reversion back toward the average line.
- Execution benchmark: Institutions accumulate or distribute around VWAP deliberately, aiming to transact near the market average without their own size moving price against them.
- Entry timing: Breaks through, rejections from, or pullbacks into VWAP provide confirmation points that traders fold into a broader setup rather than trading in isolation.
- Directional filter: Many traders restrict longs to sessions above VWAP and shorts to sessions below, a bias the long/short ratio can corroborate.
How to Set Up VWAP on TradingView
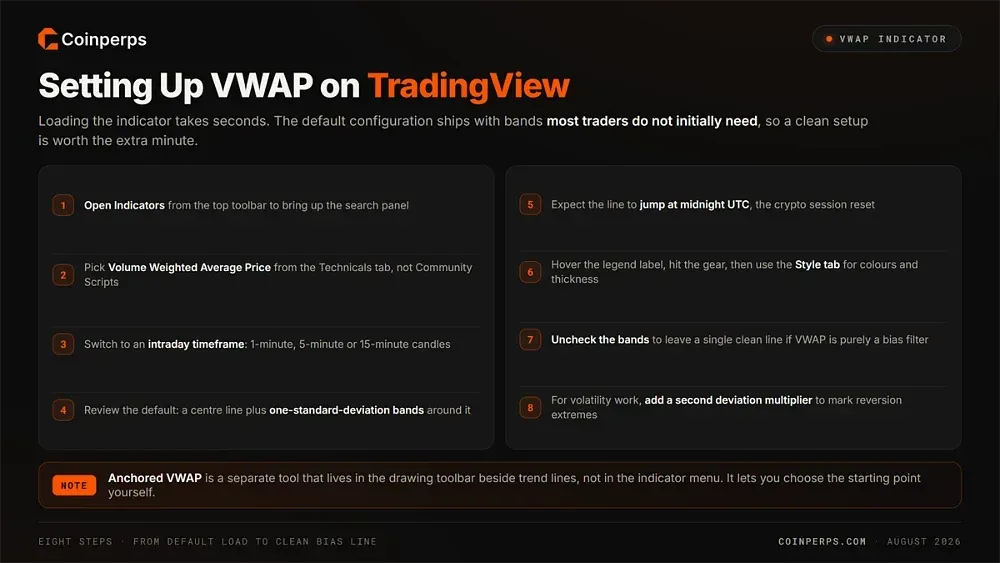
Loading VWAP takes seconds, but the default configuration includes bands most traders do not initially need.
Follow these eight steps to set it up cleanly:
- Open indicators: Click the Indicators button along the top toolbar of your TradingView chart to open the search panel.
- Search correctly: Type VWAP and select Volume Weighted Average Price from the Technicals tab, not from Community Scripts where quality varies considerably.
- Set an intraday timeframe: Switch your chart to 1-minute, 5-minute, or 15-minute candles, since VWAP is calculated per session and loses meaning on daily charts.
- Review the default: The indicator loads a central line plus upper and lower bands representing one standard deviation of price dispersion around the average.
- Understand the reset: Crypto VWAP restarts at midnight UTC each day, so expect the line to jump at that boundary rather than flowing continuously.
- Open the settings: Hover the VWAP label in the chart legend, click the gear icon, then move to the Style tab to adjust colours, thickness, and visibility.
- Simplify if needed: Uncheck Upper Band, Lower Band, and Band Fill to leave only the core VWAP line, which suits traders using it purely as a bias filter.
- Add a second band: For volatility work, enable a second standard deviation multiplier to mark the extremes where mean reversion setups typically appear.
Worth noting that TradingView also offers a separate Anchored VWAP tool, found in the drawing toolbar alongside trend lines rather than in the indicator menu. That version lets you choose the starting point yourself, which we cover in detail below.
Understanding VWAP Standard Deviation Bands
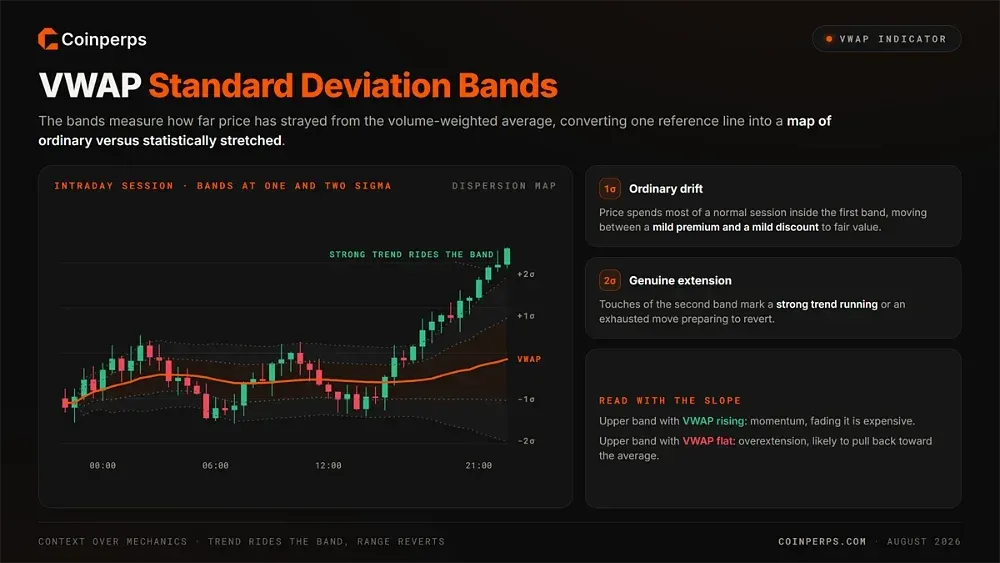
The bands surrounding VWAP measure how far price has strayed from the volume-weighted average, expressed in standard deviations of dispersion. They convert a single reference line into a full map showing which moves are ordinary and which have become statistically stretched.
Price spends most of any normal session inside the first deviation band, drifting between a mild premium and a mild discount to fair value. Touches of the second band mark genuine extension, where either a strong trend is running or an exhausted move is preparing to revert.
Reading them requires context rather than mechanical rules. In a trending session, riding the outer band is a sign of strength and fading it is expensive, whereas in a ranging session those same touches often mark reliable reversion points back toward the centre line.
The practical approach is combining band position with slope. Price at the upper band with VWAP rising flat means momentum, while price at the upper band with VWAP flat suggests overextension into a level that will likely pull back toward the average.
Anchored VWAP and Why Crypto Traders Prefer It
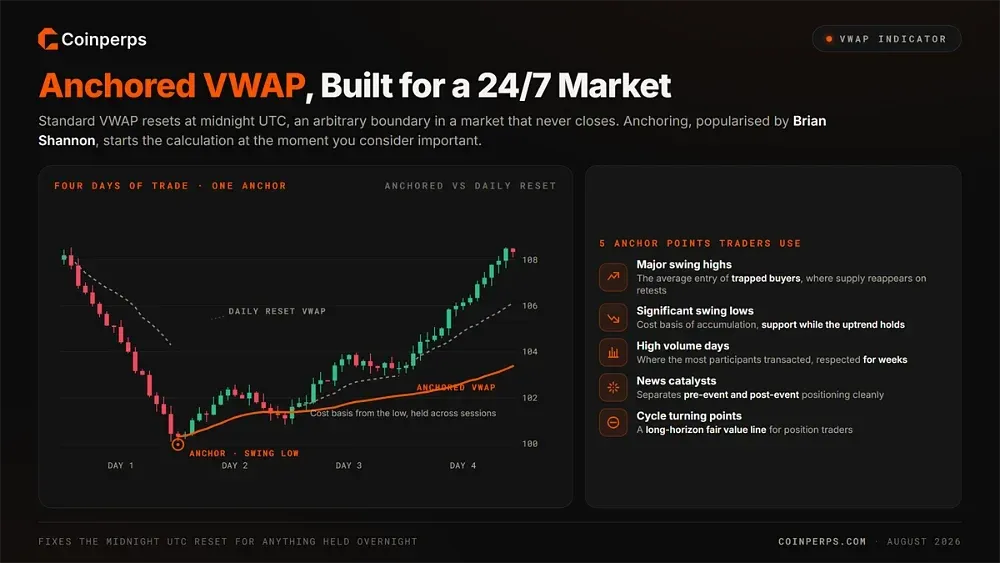
Standard VWAP resets daily, which is a genuine limitation in a market that never actually closes. Anchored VWAP solves that problem by letting you set the calculation start point yourself, measuring the average price paid since whatever moment you consider important.
The concept was popularised by Brian Shannon, who argued that anchoring to meaningful events reveals the true cost basis of participants who entered there. Anchor to a swing high and the line shows what trapped buyers paid, which is precisely where supply tends to reappear on a retest.
Traders commonly anchor VWAP to these five reference points:
- Major swing highs: Reveals the average entry of buyers who bought the top, marking where trapped positions typically sell into strength on any recovery attempt.
- Significant swing lows: Shows the cost basis of accumulation from a bottom, often acting as support that holds while a broader uptrend remains intact.
- High volume days: Anchoring to an unusually heavy session captures where the most participants transacted, creating levels that price frequently respects for weeks.
- News catalysts: Setting the anchor at a major announcement isolates how the market has priced that information, separating pre-event and post-event positioning cleanly.
- Cycle turning points: Anchoring to a macro high or low provides a long-horizon fair value line useful for position traders rather than intraday participants.
For crypto specifically, anchored VWAP fixes the arbitrary midnight UTC reset that makes standard VWAP awkward for anything held overnight. Anchoring to a genuine structural point produces a line that persists across sessions and carries meaning beyond a single trading day.
Example Scenario of Using VWAP in Crypto
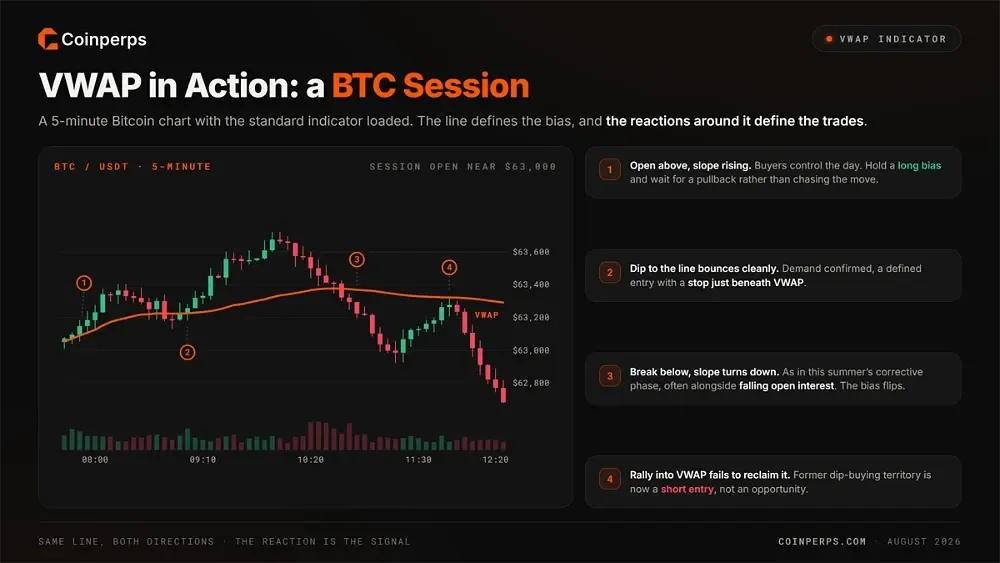
Theory becomes clearer against actual price behaviour, so consider how VWAP would have guided decisions across recent Bitcoin sessions on a 5-minute chart with the standard indicator loaded.
Early in a session where BTC opens near $63,000 and pushes above VWAP with the line sloping upward, the read is straightforward: buyers control the day. Traders holding a long bias would watch for a pullback into VWAP rather than chasing the initial move.
When price dips back toward that line and bounces cleanly, the reaction confirms the bias. Buyers defending the session's volume-weighted average signals genuine demand rather than momentum alone, and it offers a defined entry with a stop just beneath the line.
The signal flips when price breaks below VWAP and the line's slope turns down, as happened repeatedly through Bitcoin's corrective phase this summer, often alongside falling open interest. From that point, rallies into VWAP that fail to reclaim it become short entries rather than dip-buying opportunities.
VWAP vs Moving Averages (SMA and EMA)
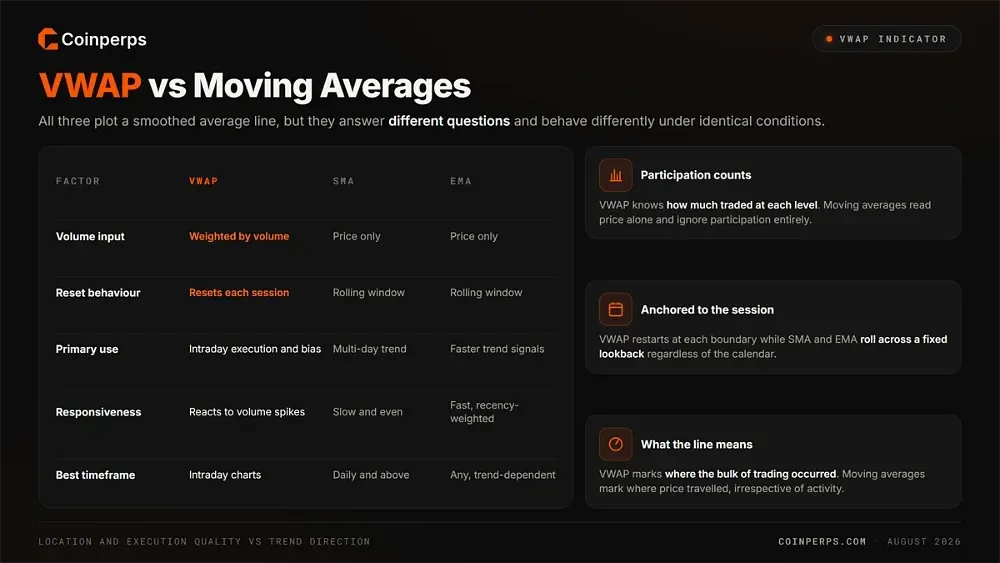
VWAP invites comparison with moving averages because all three plot a smoothed average line, but they answer different questions and behave differently under identical conditions.
The six differences that matter in practice are:
- Volume sensitivity: VWAP incorporates how much traded at each level, while both moving averages read price alone and ignore participation entirely.
- Session anchoring: VWAP resets at each session boundary whereas SMA and EMA roll continuously across a fixed lookback regardless of the calendar.
- Analytical purpose: Moving averages track broader trend direction, while VWAP assesses trade location and execution quality within the current session.
- Reaction profile: EMA weights recent candles most heavily, whereas VWAP responds to volume magnitude regardless of when it occurred during the session.
- Timeframe suitability: VWAP applies to intraday analysis specifically, while SMA and EMA remain useful across days, weeks, and months.
- What the line represents: VWAP marks where the bulk of trading occurred, while moving averages simply mark where price travelled irrespective of activity.
VWAP Strategy Performance Backed by Data
Anecdote is cheap in trading, so it is worth examining what happens when a VWAP rule set is tested systematically rather than eyeballed on a favourable chart.
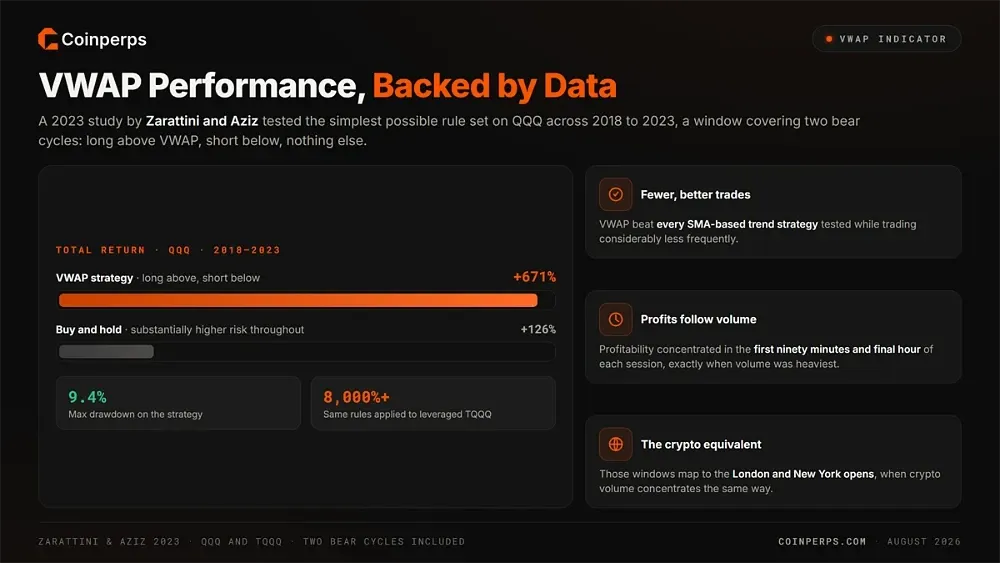
A 2023 study by Zarattini and Aziz tested a VWAP day trading strategy on QQQ and TQQQ across 2018 to 2023, a window covering two bear cycles. The rules were deliberately simple: go long above VWAP, short below it, using the volume-weighted line as the sole trend filter.
The QQQ results produced a 671% total return against a 9.4% maximum drawdown, compared with 126% for a buy-and-hold approach carrying substantially higher risk throughout. Applied to the leveraged TQQQ, the same rule set returned over 8,000% with a comparable drawdown profile.
Two findings travel usefully into crypto markets. VWAP outperformed every SMA-based trend strategy tested while trading considerably less frequently, and profitability concentrated in the first ninety minutes and the final hour of each session, precisely when volume was heaviest. The crypto equivalents are the London and New York opens.
Combining VWAP With Derivatives Data
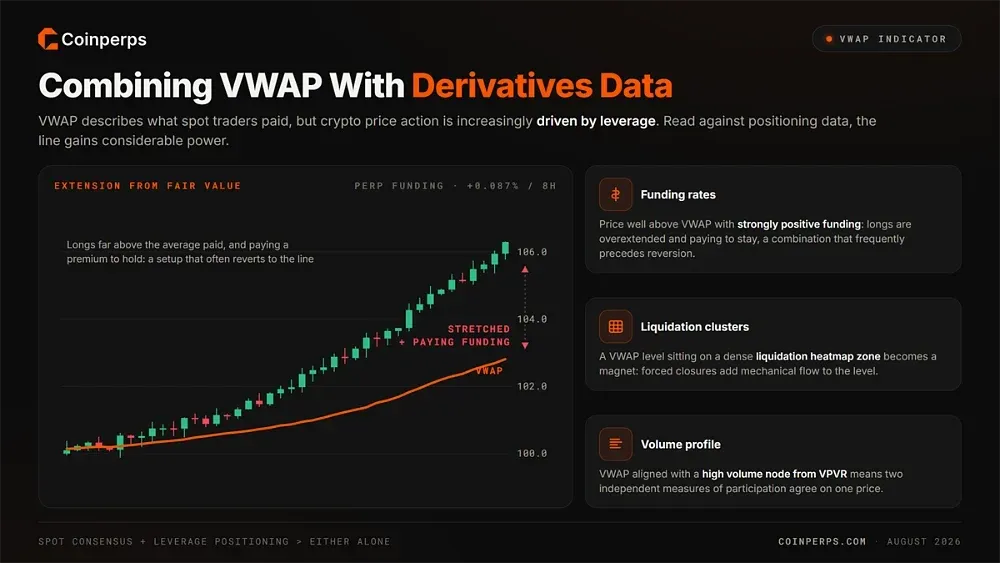
VWAP describes what spot traders paid, but crypto price action is increasingly driven by leverage, which means the indicator gains considerable power when read against positioning data rather than in isolation.
Funding rates provide the first useful overlay. When price sits well above VWAP and funding is simultaneously strongly positive, longs are both overextended from fair value and paying a premium to hold, a combination that frequently precedes a reversion back toward the line.
Liquidation clusters provide the second. A VWAP level coinciding with a dense zone on the Bitcoin liquidation heatmap, or its Ethereum equivalent, becomes a magnet, because forced closures there add mechanical order flow on top of the discretionary activity VWAP already attracts.
Volume profile completes the picture. Where VWAP aligns closely with a high volume node drawn from VPVR, you have two independent measures of participation agreeing on the same price level, which is far stronger evidence than either tool produces on its own.
Common VWAP Mistakes to Avoid
Most VWAP failures trace back to using the indicator outside the conditions it was designed for, rather than any flaw in the tool itself.
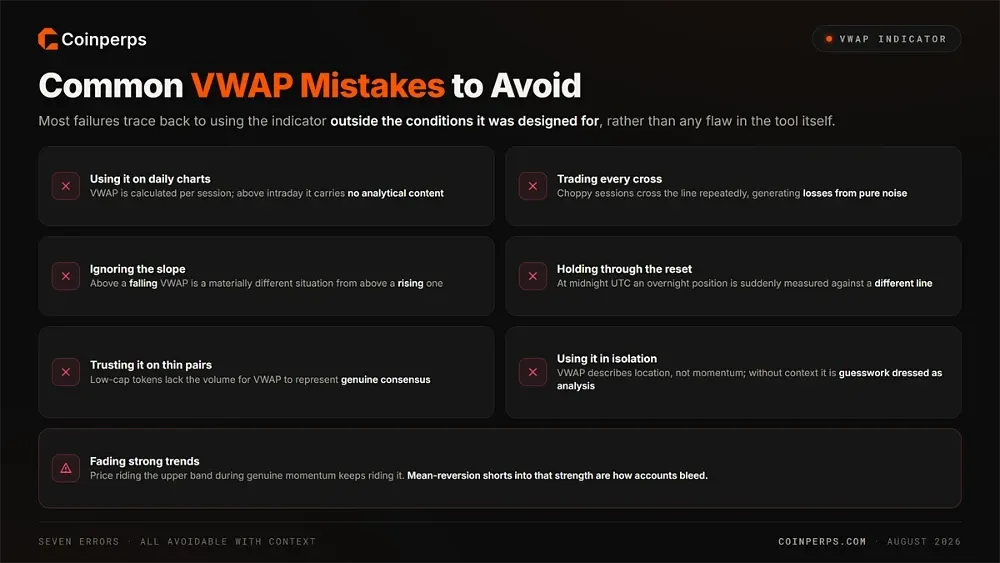
The errors worth avoiding are:
- Using it on daily charts: VWAP is calculated per session, so applying it above intraday timeframes produces a line with no meaningful analytical content whatsoever.
- Trading every cross: In choppy conditions price crosses VWAP repeatedly, and treating each break as a signal generates a stream of losing trades from pure noise.
- Ignoring the slope: Price above a falling VWAP is a materially different situation from price above a rising one, yet many traders read only the position.
- Holding through the reset: Standard VWAP restarts at midnight UTC, so a position held overnight is suddenly measured against a completely different reference line.
- Trusting it on thin pairs: Low-cap tokens tracked on the altcoin season index often lack the volume for VWAP to represent genuine consensus.
- Using it in isolation: VWAP describes location, not momentum or positioning, so trading it without confirming context is guesswork dressed as analysis.
- Fading strong trends: Price riding the upper band during genuine momentum will keep riding it, and mean-reversion shorts into that strength are how accounts bleed.
Pros and Cons of Using VWAP in Different Market Conditions
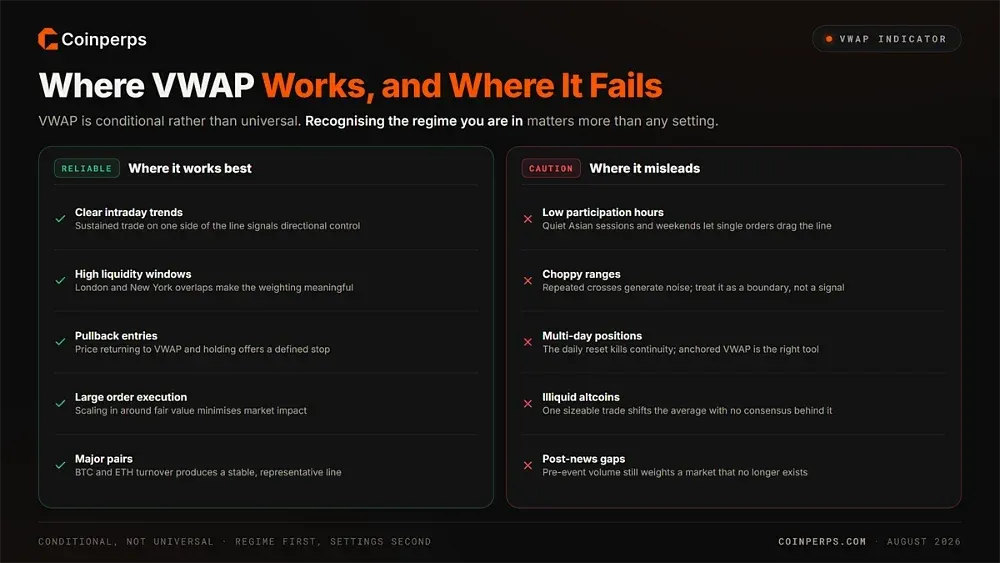
VWAP is conditional rather than universal, performing well when volume is concentrated and price respects volume-weighted levels, and poorly when neither holds true. Recognising which regime you are in, which live perpetual futures data helps confirm, matters more than any setting.
Where VWAP Tends to Work Best
The indicator performs best when participation is heavy and price action has structure worth measuring against.
VWAP is most reliable in these conditions:
- Clear intraday trends: Sustained trading above or below the line signals directional control, letting traders align entries with the dominant flow of the session.
- High liquidity windows: During the London and New York overlaps, VWAP reflects genuine consensus because volume is concentrated enough to make the weighting meaningful.
- Pullback entries: In trending moves, price returning to VWAP and holding provides a defined entry with a logical stop just beyond the line.
- Large order execution: Traders working significant size use VWAP as a fair value benchmark, scaling in around it to minimise the market impact of their own flow.
- Major pairs: BTC and ETH carry enough turnover across the top perpetual exchanges that volume weighting produces a stable, representative line.
Where VWAP Can Mislead or Lag
The same mechanics break down when volume thins or price loses structure, and knowing the failure modes prevents costly misreads.
Treat VWAP cautiously in these situations:
- Low participation hours: During quiet Asian sessions or weekends, a handful of large orders can drag VWAP somewhere price never meaningfully traded.
- Choppy ranges: When price oscillates across the line repeatedly, VWAP generates noise rather than direction and works better as a boundary than a signal.
- Multi-day positions: The daily reset means standard VWAP offers no continuity for swing trades, making anchored VWAP the appropriate tool instead.
- Illiquid altcoins: In thin pairs, one sizeable trade shifts the average sharply, producing levels unsupported by any broader market consensus.
- Post-news gaps: After a sharp catalyst that flips the fear and greed index, pre-event volume still weighting VWAP describes a market that no longer exists.
Bottom Line
VWAP is not a signal generator, and traders who treat it as one tend to discover that expensively. It is a location tool that answers one question precisely: relative to where volume actually transacted this session, is price expensive or cheap right now?
Answered honestly, that framing improves your entries, sharpens directional bias, and stops you buying strength into a level the market has already rejected once. Combined with slope, band position, and confirmation from funding or liquidation data, it becomes a genuine decision framework.
For crypto specifically, and especially for anyone trading perpetual futures rather than spot, the anchored variant deserves more attention than the standard version. A market trading continuously has no natural session boundary, so choosing your own anchor at a structurally meaningful point produces a far more useful line than accepting an arbitrary midnight reset.
FAQs
