What is Cumulative Volume Delta (CVD)?
Cumulative Volume Delta shows whether aggressive buyers or sellers control the market. Learn how to read it, spot divergences, and avoid the common traps.

- What CVD measures: The running net of aggressive buying minus aggressive selling, showing which side has been paying up to get filled across the market and over time.
- How to use it: Confirm breakouts, identify divergences between price and pressure, and detect accumulation hidden within a quiet range before the eventual move begins.
- Why it matters in crypto: Spot and perpetual readings often disagree. That gap indicates whether a move rests on real demand or leverage, helping distinguish conviction from positioning.
Price shows where a market ended up, while volume shows how busy it was. Neither tells you who was willing to pay up, which is the question behind many intraday trades.
Cumulative Volume Delta does. It assigns every executed trade to whichever side crossed the spread and maintains a running tally, separating conviction from passive matching.
That distinction is especially useful in crypto. Thin depth and heavy leverage can move price even when little real buying sits behind the move. This guide explains the calculation and setup, the readings that matter, and the situations where the indicator can mislead.
What is Cumulative Volume Delta (CVD) in Trading?
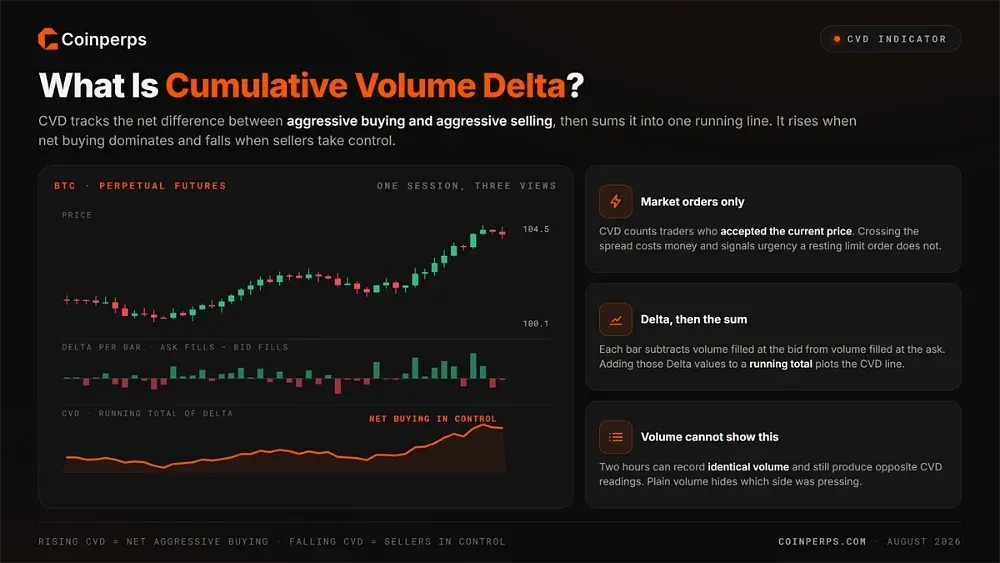
Cumulative Volume Delta shows which side of the market has been more aggressive over a chosen period. Instead of combining all activity into one volume figure, it tracks the net difference between buying and selling activity.
Each bar generates a Delta value by subtracting volume filled at the bid from volume filled at the ask. Those values are added to a running total to form the CVD line. It rises when net buying dominates and falls when sellers take control.
Only executed market orders are captured. In other words, CVD measures traders who accepted the current price rather than waiting for a fill. The distinction matters because crossing the spread costs money and signals urgency that a resting limit order does not.
Plain volume cannot show that difference. Two hours may record identical volume and still produce opposite CVD readings.
How CVD Is Calculated
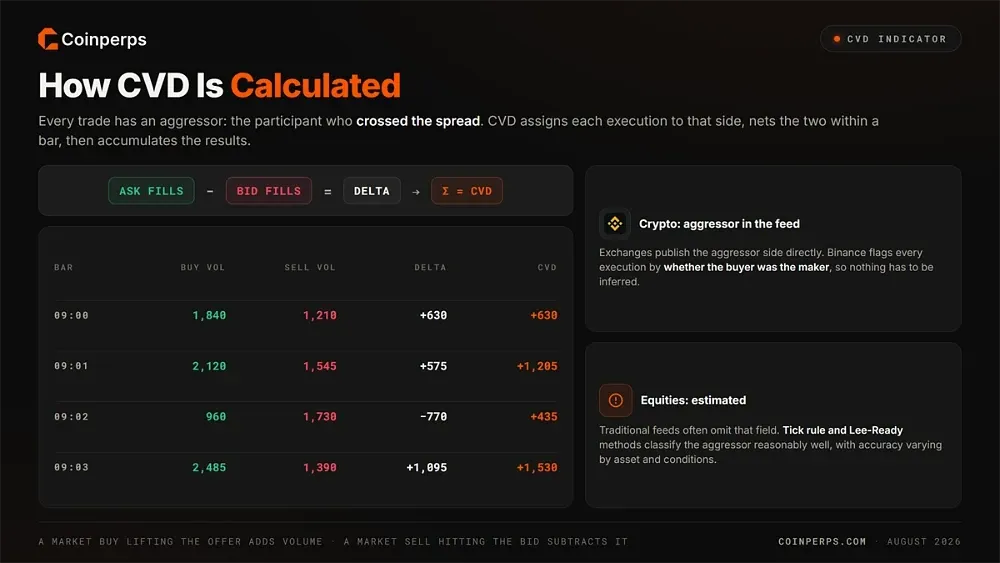
The arithmetic also defines the indicator's limits. Every trade has an aggressor: the participant who crossed the spread. CVD assigns each execution to that side and then sums the results.
A market buy that lifts the offer contributes positive volume. A market sell hitting the bid contributes negative volume. Subtract the latter from the former within a bar to calculate that bar's Delta, then accumulate the values to plot the line.
Crypto has an advantage here over equities. Exchanges publish aggressor-side information directly in their trade feeds. Binance flags each execution according to whether the buyer was the maker, removing the need to infer the aggressor.
Traditional markets often do not provide that field and must estimate it instead. Research comparing classification methods finds that tick rule and Lee-Ready approaches classify the aggressor side reasonably well, although accuracy varies by asset and market condition.
How to View CVD on TradingView
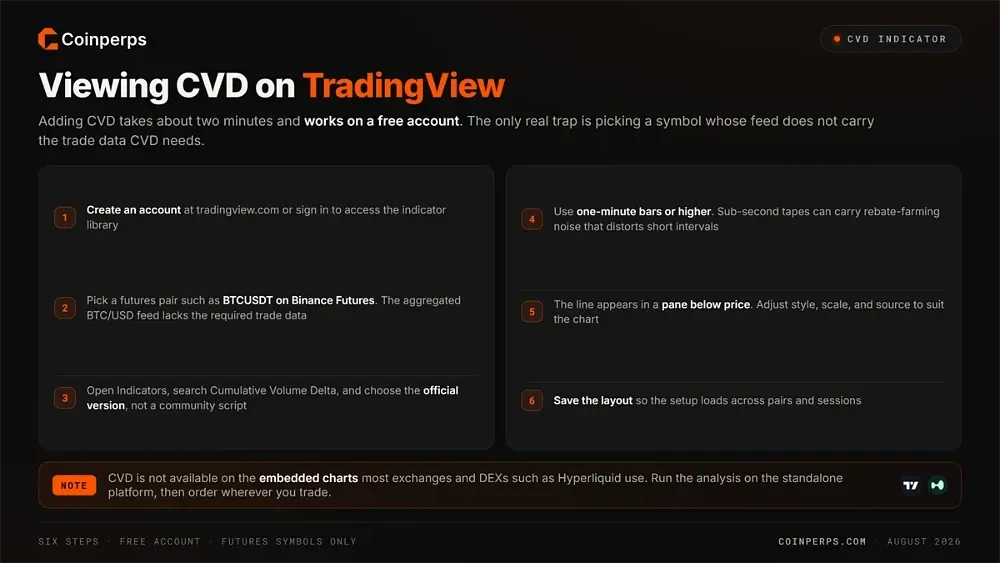
Adding CVD to a chart takes about two minutes and works on a free account.
Follow these six steps:
- Create an account: Register at tradingview.com or sign in to an existing profile to access the indicator library and save chart layouts.
- Pick the right symbol: Search for a futures pair such as BTCUSDT on Binance Futures. The default aggregated BTC/USD feed does not contain the trade data CVD requires.
- Add the indicator: Open the Indicators panel, search Cumulative Volume Delta, and choose the official version instead of a community script of unknown quality.
- Set your timeframe: Use one-minute bars or higher. Sub-second tapes on some exchanges contain rebate-farming activity that can distort very short intervals.
- Adjust the display: The line appears in a pane below price. Change its style, scale, and source as needed for your chart.
- Save the layout: Store the configuration so it loads across pairs and sessions without having to rebuild the setup.
CVD does not work on the embedded TradingView charts used by most exchanges and decentralised platforms such as Hyperliquid. Run the analysis on the standalone platform, then place orders wherever you trade.
Why CVD Matters for Buying and Selling Pressure
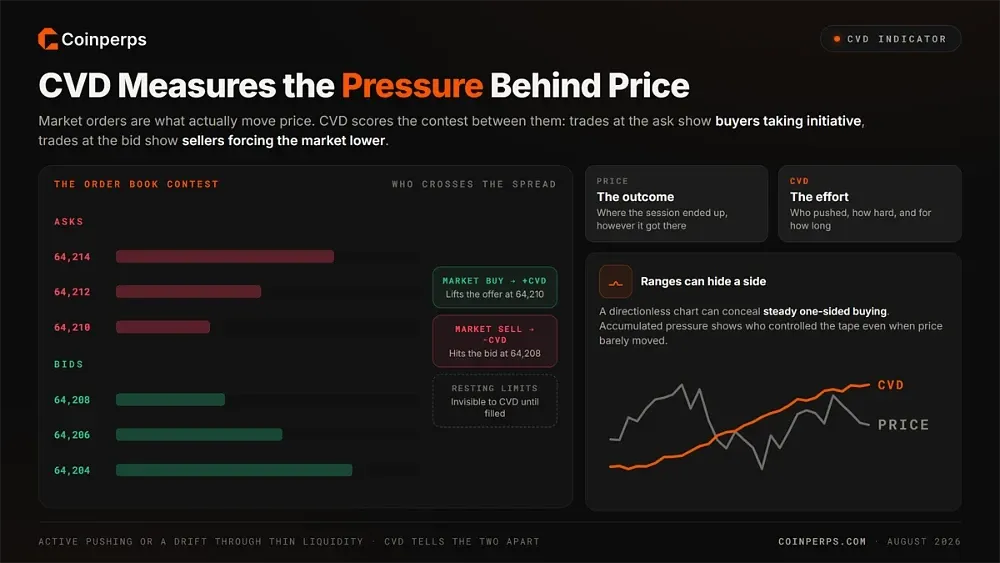
Market orders provide the pressure that moves price, and CVD measures the contest between buyers and sellers through those orders. Trades executed at the ask show buyers taking initiative. Trades at the bid indicate sellers forcing the market lower.
Accumulating that pressure over time shows which side controlled the tape, even when price moved very little. A seemingly directionless range can conceal steady one-sided buying.
Price records the session's outcome; CVD captures the effort behind it. You can therefore judge whether participants actively pushed a move or whether price simply drifted through thin liquidity.
Spot CVD vs Perpetual CVD
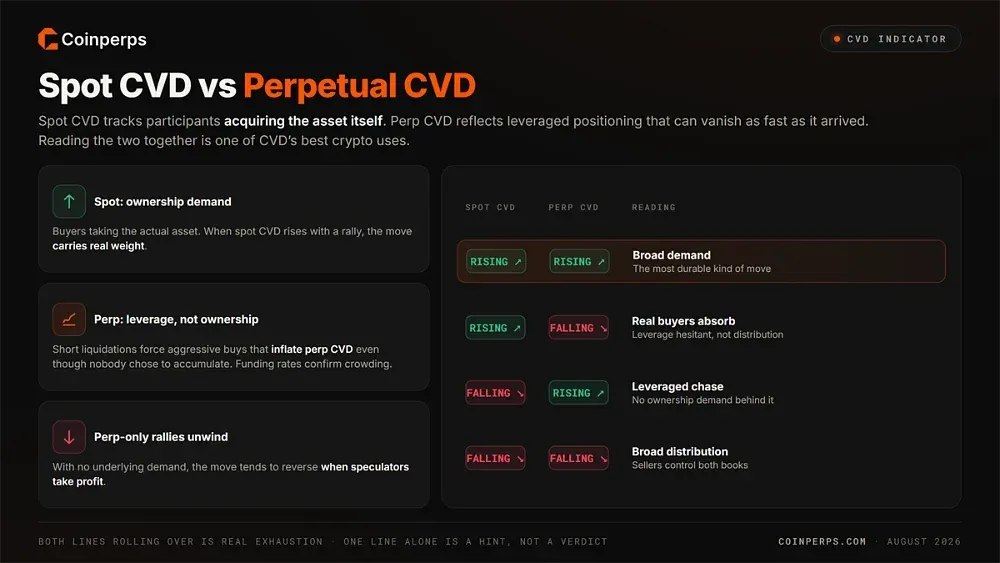
One of CVD's most useful crypto-specific applications is comparing spot with perpetual readings. Spot CVD tracks participants acquiring the asset itself. Perpetual CVD instead reflects leveraged positioning, which can disappear as quickly as it arrived.
Leverage can create artificial pressure. Short liquidations produce forced aggressive buy orders, inflating perpetual CVD even though no participant chose to accumulate the asset. Funding rates help confirm when positioning has become crowded.
A rally driven only by perpetual CVD tends to unwind when speculators take profit because there was no underlying demand for the asset itself. When spot CVD rises alongside it, the rally carries more weight.
Differences between the two also make bearish signals more precise. A weak perpetual reading paired with rising spot CVD points to hesitation among leveraged traders rather than distribution. When both lines roll over, the evidence instead points to real exhaustion.
CVD in Crypto Markets vs Traditional Futures
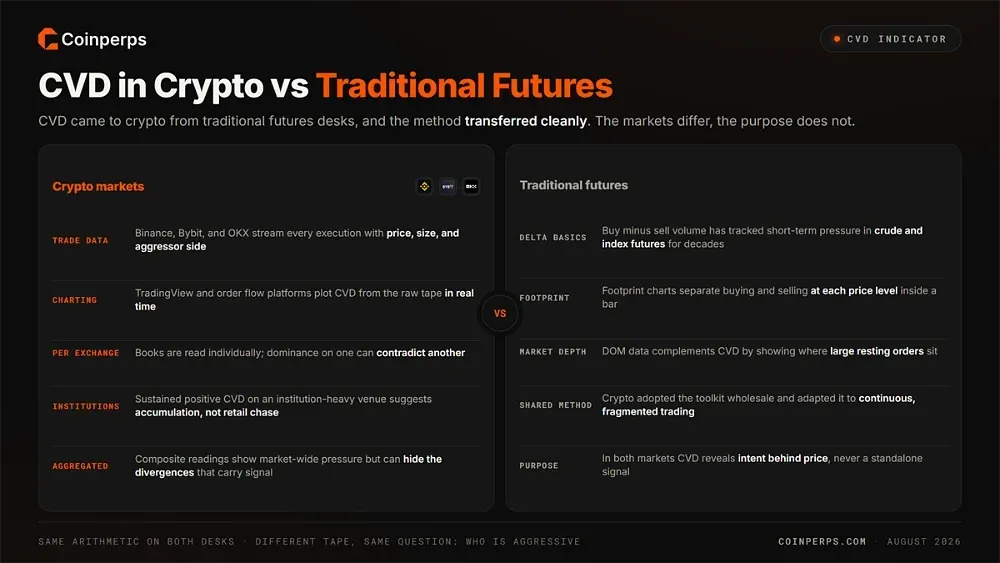
CVD came to crypto from traditional futures desks. Despite the differences between the markets, the method transferred cleanly.
CVD in Crypto Markets
Crypto traders use CVD to measure aggressive orders across exchanges and determine who controls each book.
- Trade data: Exchanges including Binance, Bybit, and OKX stream every execution with its price, size, and aggressor side.
- Charting tools: TradingView and dedicated order flow platforms turn that raw trade data into real-time CVD calculations and plots.
- Exchange-level reading: Traders examine exchanges individually because buying dominance on one book can contradict activity on another.
- Institutional signals: Sustained positive CVD on an institution-heavy exchange suggests larger participants are accumulating rather than the move being driven by retail speculation.
- Aggregated view: Composite readings across exchanges reveal market-wide pressure, but combining books can hide the divergences that often contain the signal.
CVD in Traditional Futures
Futures traders have used delta analysis for decades to follow institutional participation in regulated markets.
- Delta basics: Buy volume minus sell volume reveals short-term pressure in contracts such as crude oil or equity index futures.
- Footprint charts: Footprint displays separate buying and selling at each individual price level within a bar.
- Market depth: Depth of Market data complements CVD by showing where large resting orders sit.
- Shared method: Crypto traders adopted these tools wholesale and adapted them to continuous trading with liquidity divided across many exchanges.
- Common purpose: In both markets, CVD serves the same purpose: revealing intent behind price rather than acting as a standalone signal.
Practical Strategies for Using CVD in Trading
Understanding what CVD measures is only part of the job. Its value depends on knowing when the reading should influence a decision. These three applications add the most.
Spotting Divergences Between CVD and Price
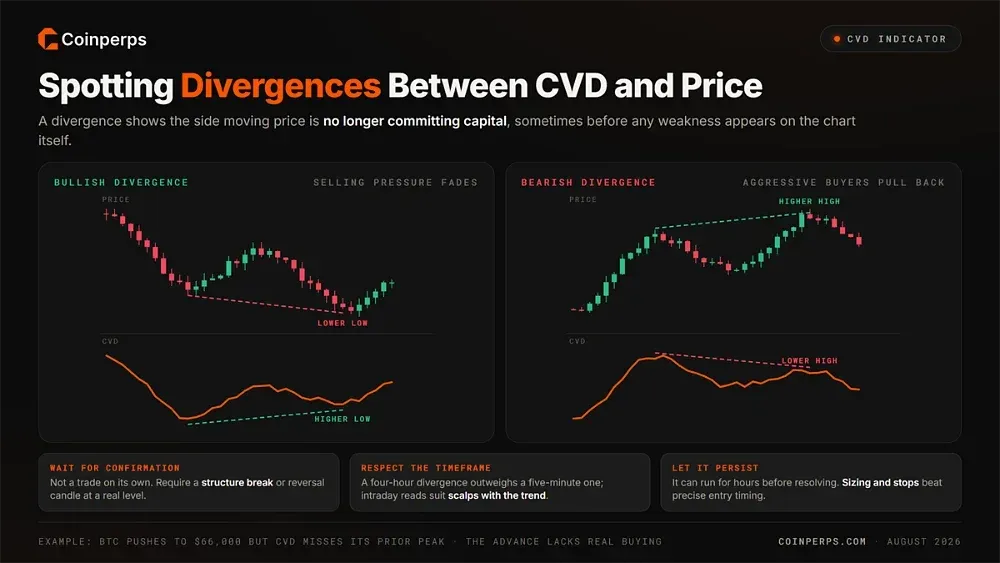
A divergence can reveal that the side moving price is no longer committing capital, sometimes before weakness becomes visible on the chart.
- Bullish divergence: Price makes a lower low while CVD makes a higher low. Selling pressure is fading, and buyers may be absorbing supply.
- Bearish divergence: Price reaches a higher high as CVD records a lower high, indicating that aggressive buyers are pulling back while the move loses support.
- Wait for confirmation: Do not treat divergence alone as a trade. Require a structure break, trendline violation, or reversal candle near a meaningful level.
- Respect the timeframe: A four-hour divergence carries more weight than a five-minute reading, although intraday signals can work for scalps aligned with the larger trend.
- Allow it to persist: Divergence may continue for hours before resolving. Position sizing and stop placement therefore matter more than precise entry timing.
- Worked example: If Bitcoin pushes to $66,000 while CVD fails to exceed its previous peak, the advance appears to lack the buying that produced the earlier high.
Confirming Breakout or Reversal Strength
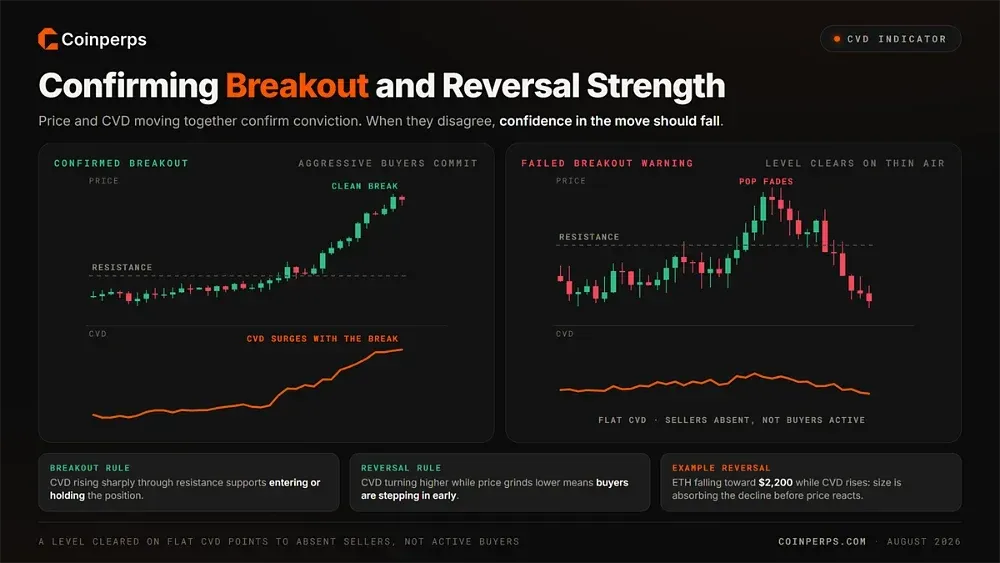
CVD helps distinguish a breakout supported by real buying from one that simply drifts through a level because participation is thin.
- Breakout confirmation: If CVD rises sharply as price clears resistance, aggressive buyers are committing to the move. That supports entering or holding the position.
- Reversal confirmation: When CVD turns higher while price continues grinding lower, buyers are stepping in early. This creates a stronger foundation than a bounce accompanied by flat delta.
- Alignment rule: Price and CVD moving together confirm conviction. If they disagree, confidence in the move should fall.
- Failed breakout warning: Price may clear a level while CVD remains flat. That points to a move caused by absent sellers rather than active buyers.
- Example reversal: Ethereum falling toward $2,200 while CVD rises suggests larger participants are absorbing the decline before price reacts.
- Example breakout: When a major pair clears long-standing resistance at the same moment CVD surges, the evidence supports treating the level as reclaimed.
Timing Entries During Consolidation
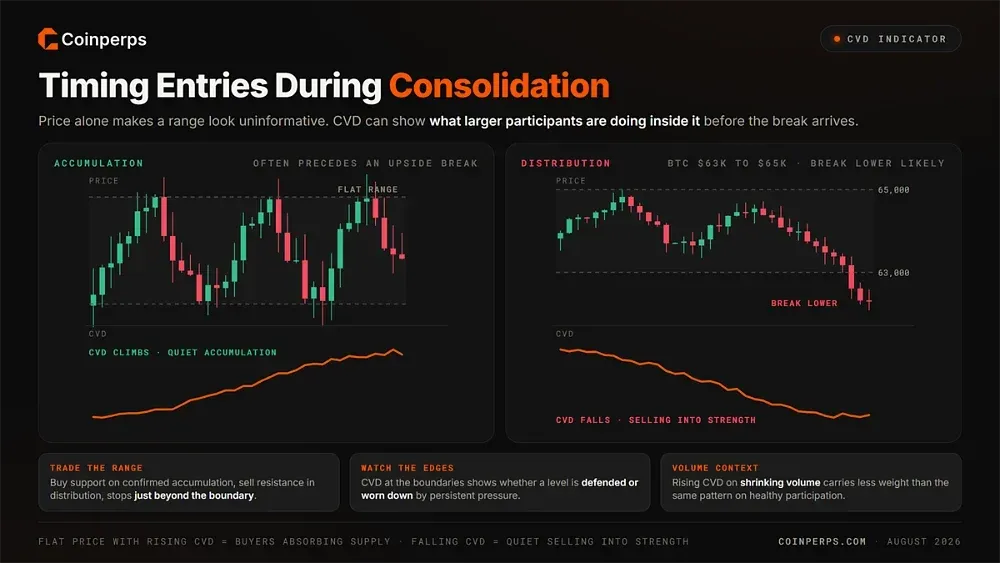
Price alone can make a range look uninformative. CVD may show what larger participants are doing inside it.
- Accumulation pattern: When price stays flat while CVD rises steadily, buyers are absorbing supply without pushing the market higher. This frequently comes before an upside break.
- Distribution pattern: Flat or slightly higher price alongside falling CVD points to quiet selling into strength and makes a downside resolution more likely.
- Trade the range: Buy near support when CVD confirms accumulation, or sell near resistance during distribution. Keep stops just beyond the range boundary.
- Watch the boundaries: CVD behaviour near range edges shows whether a level is being defended or gradually worn down by persistent pressure.
- Volume context: A rising CVD line on shrinking volume carries less weight than the same pattern accompanied by healthy participation.
- Range example: Bitcoin holding between $63,000 and $65,000 while CVD falls steadily points to distribution and a probable break lower.
How to Spot Absorption With CVD
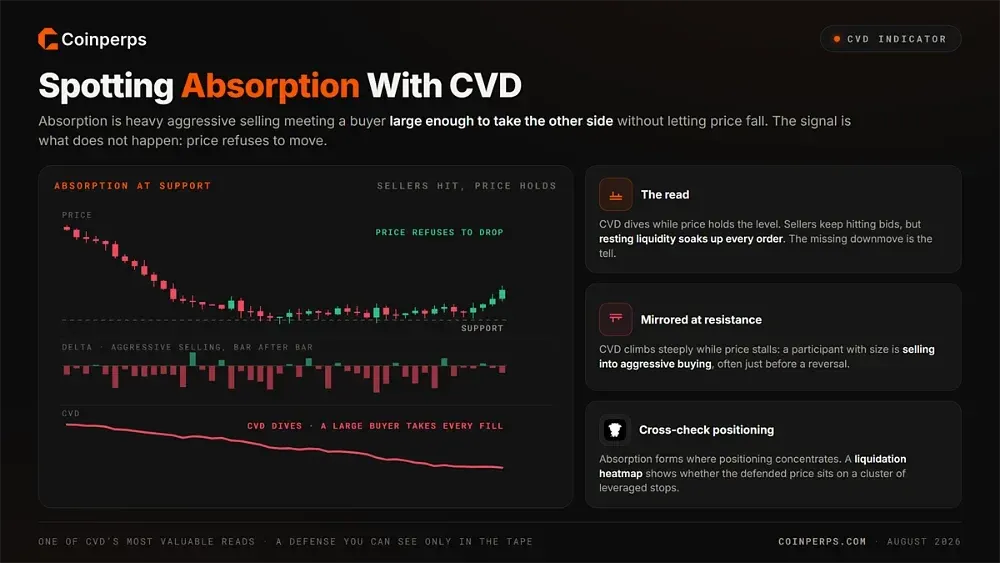
Absorption happens when heavy aggressive selling meets a buyer large enough to take the other side without allowing price to fall. Reading this pattern correctly is one of CVD's most valuable uses.
It appears as a sharp CVD decline while price continues to hold a level. Sellers keep hitting bids, but someone absorbs those orders with resting liquidity. The signal is the lack of corresponding downward price movement.
At resistance, the pattern reverses. CVD climbs steeply while price stalls, showing that a participant with size is selling into aggressive buying, often before a reversal.
Absorption often forms near levels where positioning is concentrated. Comparing the setup with the Bitcoin liquidation heatmap can show whether the defended price also sits near a cluster of leveraged stops.
Combining CVD With Other Tools
CVD can explain the pressure behind a move. Other indicators help determine how to respond to that information.
These combinations earn their place:
- CVD and VWAP: Use VWAP as the session bias anchor, then see whether aggressive participants are reinforcing that bias or trading against it.
- CVD and open interest: Rising price accompanied by higher CVD and increasing open interest confirms new money entering. Falling open interest instead suggests short covering.
- CVD and funding: Extreme funding combined with contradictory CVD readings often comes before a squeeze because positioning has separated from actual buying.
- CVD and liquidation data: Sudden CVD spikes occurring alongside liquidation clusters reflect forced closures rather than deliberate trading decisions.
- CVD and positioning: The long/short ratio shows how traders are positioned. CVD indicates what those traders are doing about it at that moment.
- CVD and footprint charts: Footprint charts show buying and selling imbalances at each price; CVD compresses that detail into one running measure.
- CVD and support levels: Around major levels, CVD can distinguish buyers absorbing supply from sellers successfully defending price.
- CVD and RSI: When momentum divergence confirms a CVD divergence, the reversal case is stronger than either signal on its own.

Limitations and Risks of Using CVD
CVD describes completed activity rather than predicting future price. Several market conditions can also reduce its reliability.
Weigh these limitations:
- Thin liquidity distortion: On illiquid pairs, one large order can swing delta sharply without reflecting meaningful intent across the broader market.
- Invisible passive liquidity: Resting limit orders remain invisible until they fill, so iceberg orders can move price while leaving little trace in CVD.
- Single-exchange blindness: A large trade executed on one exchange never appears in another exchange's CVD. Some divergences therefore reflect missing data rather than genuine pressure.
- Fragmented markets: Liquidity is divided across dozens of perpetual exchanges, preventing any single reading from capturing market-wide activity.
- Tape contamination: Some exchanges report wash-like rebate farming that inflates readings at very short intervals and creates false signals of conviction.
- No predictive claim: Because CVD reports activity that has already happened, treating a rising line as a forecast can lead to poor entries.
- Context dependence: Reading CVD without chart structure, trend, or key levels often produces confident conclusions that price later contradicts.

Bottom Line
CVD measures who has been paying up rather than where price ultimately finished. It is best treated as a check on conviction, not a standalone signal generator. Use it to validate breakouts, identify divergences, and assess intent around key levels.
For crypto traders, the spot-versus-perpetual comparison is its strongest application. It separates moves backed by real demand from those supported by leverage that can unwind within minutes.
CVD should remain one input among several. When it supports your read, size with more confidence. If it contradicts the setup, reduce exposure or wait for a cleaner opportunity.
FAQs
